Happy Elementor Addons Pro has introduced a new widget Polar Area chart. You can show all your stats of your website in a more stylish and smart way. It has some exclusive features that will help you make extraordinary designs for your charts.
Using the Polar Area chart widget
Step 1:
Select the Polar Area chart widget from the menu bar on the left-hand side of the screen then drag and drop it in the selected area.

Step 2:
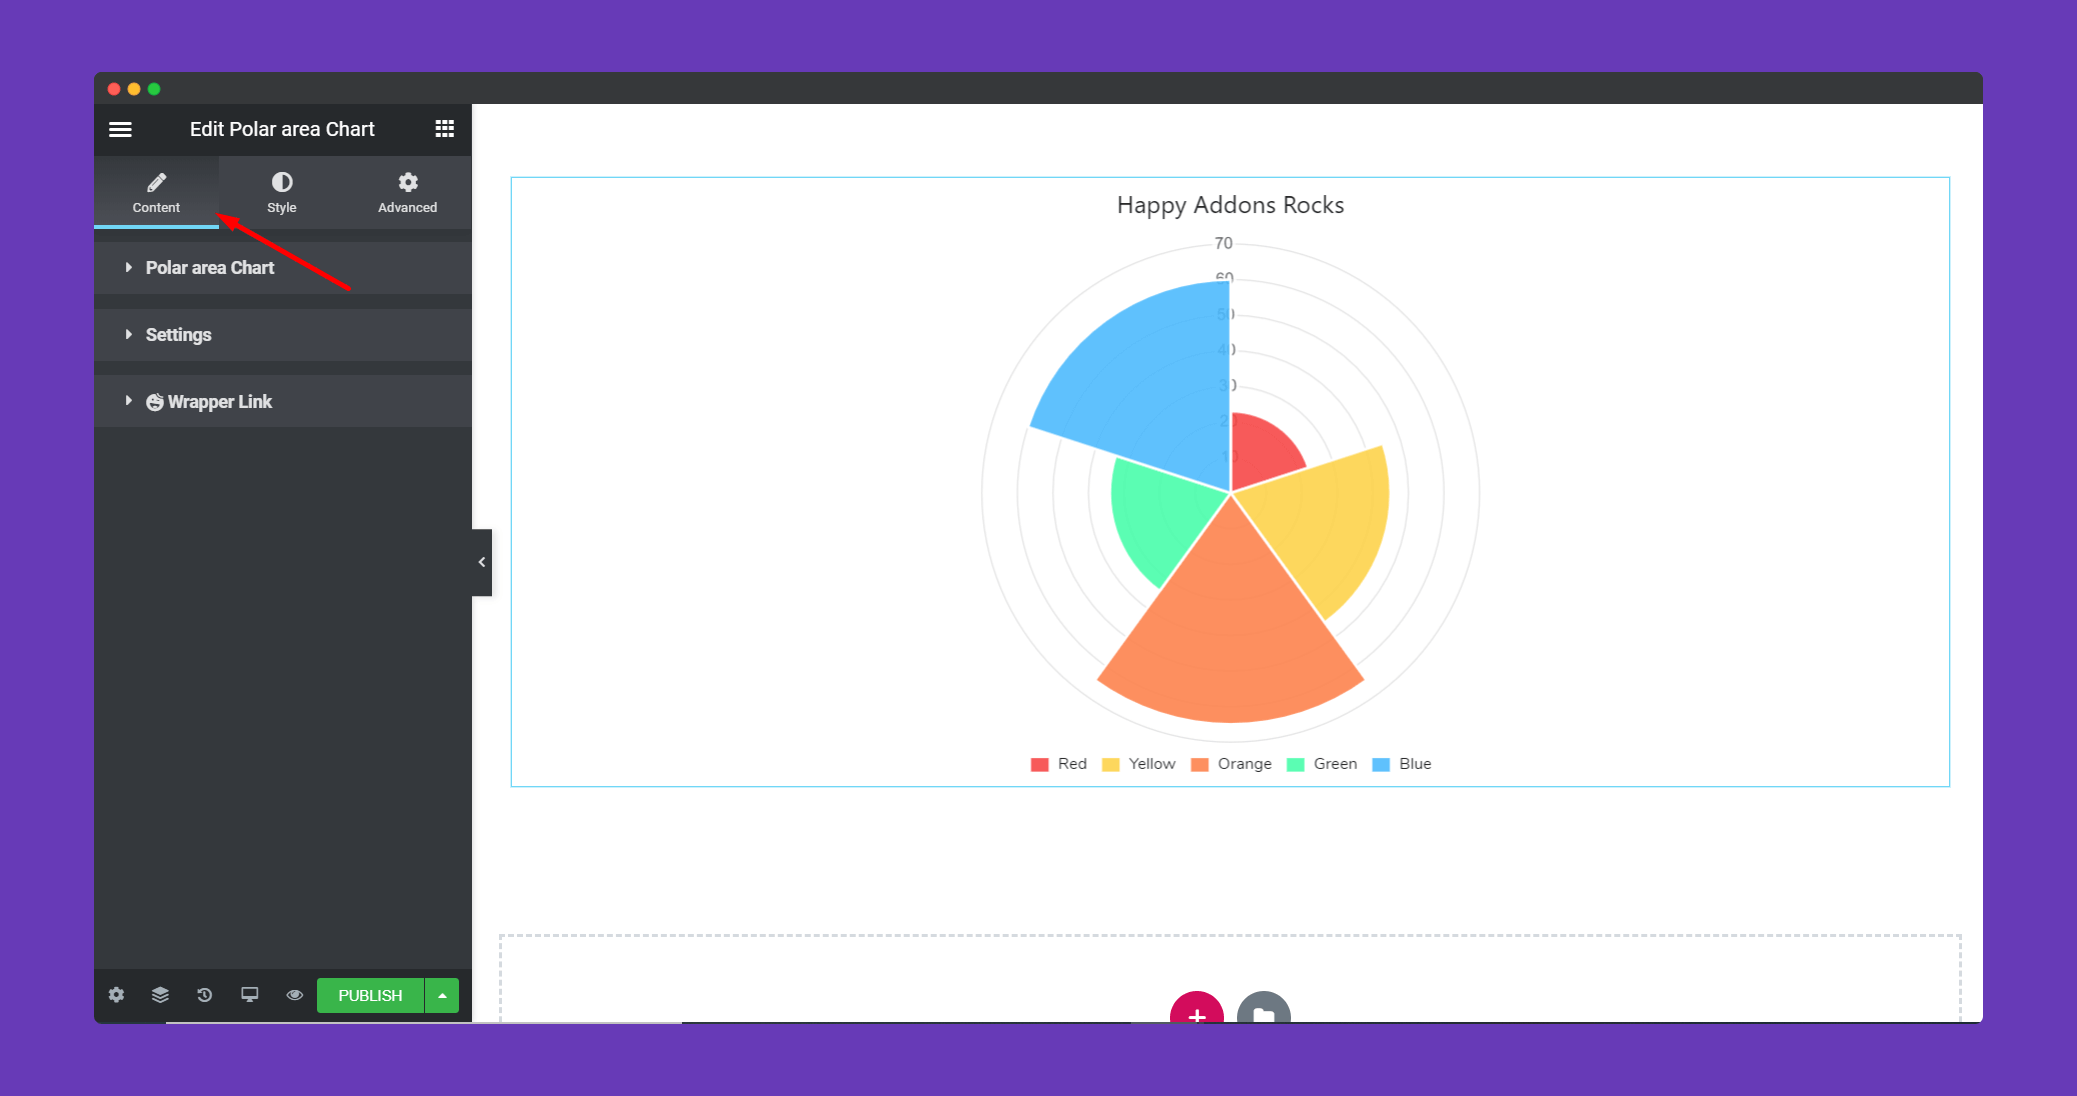
In the ‘Content‘ section, you will find options to edit ‘Polar Area Chart‘, ‘Settings‘, ‘Wrapper Link‘.
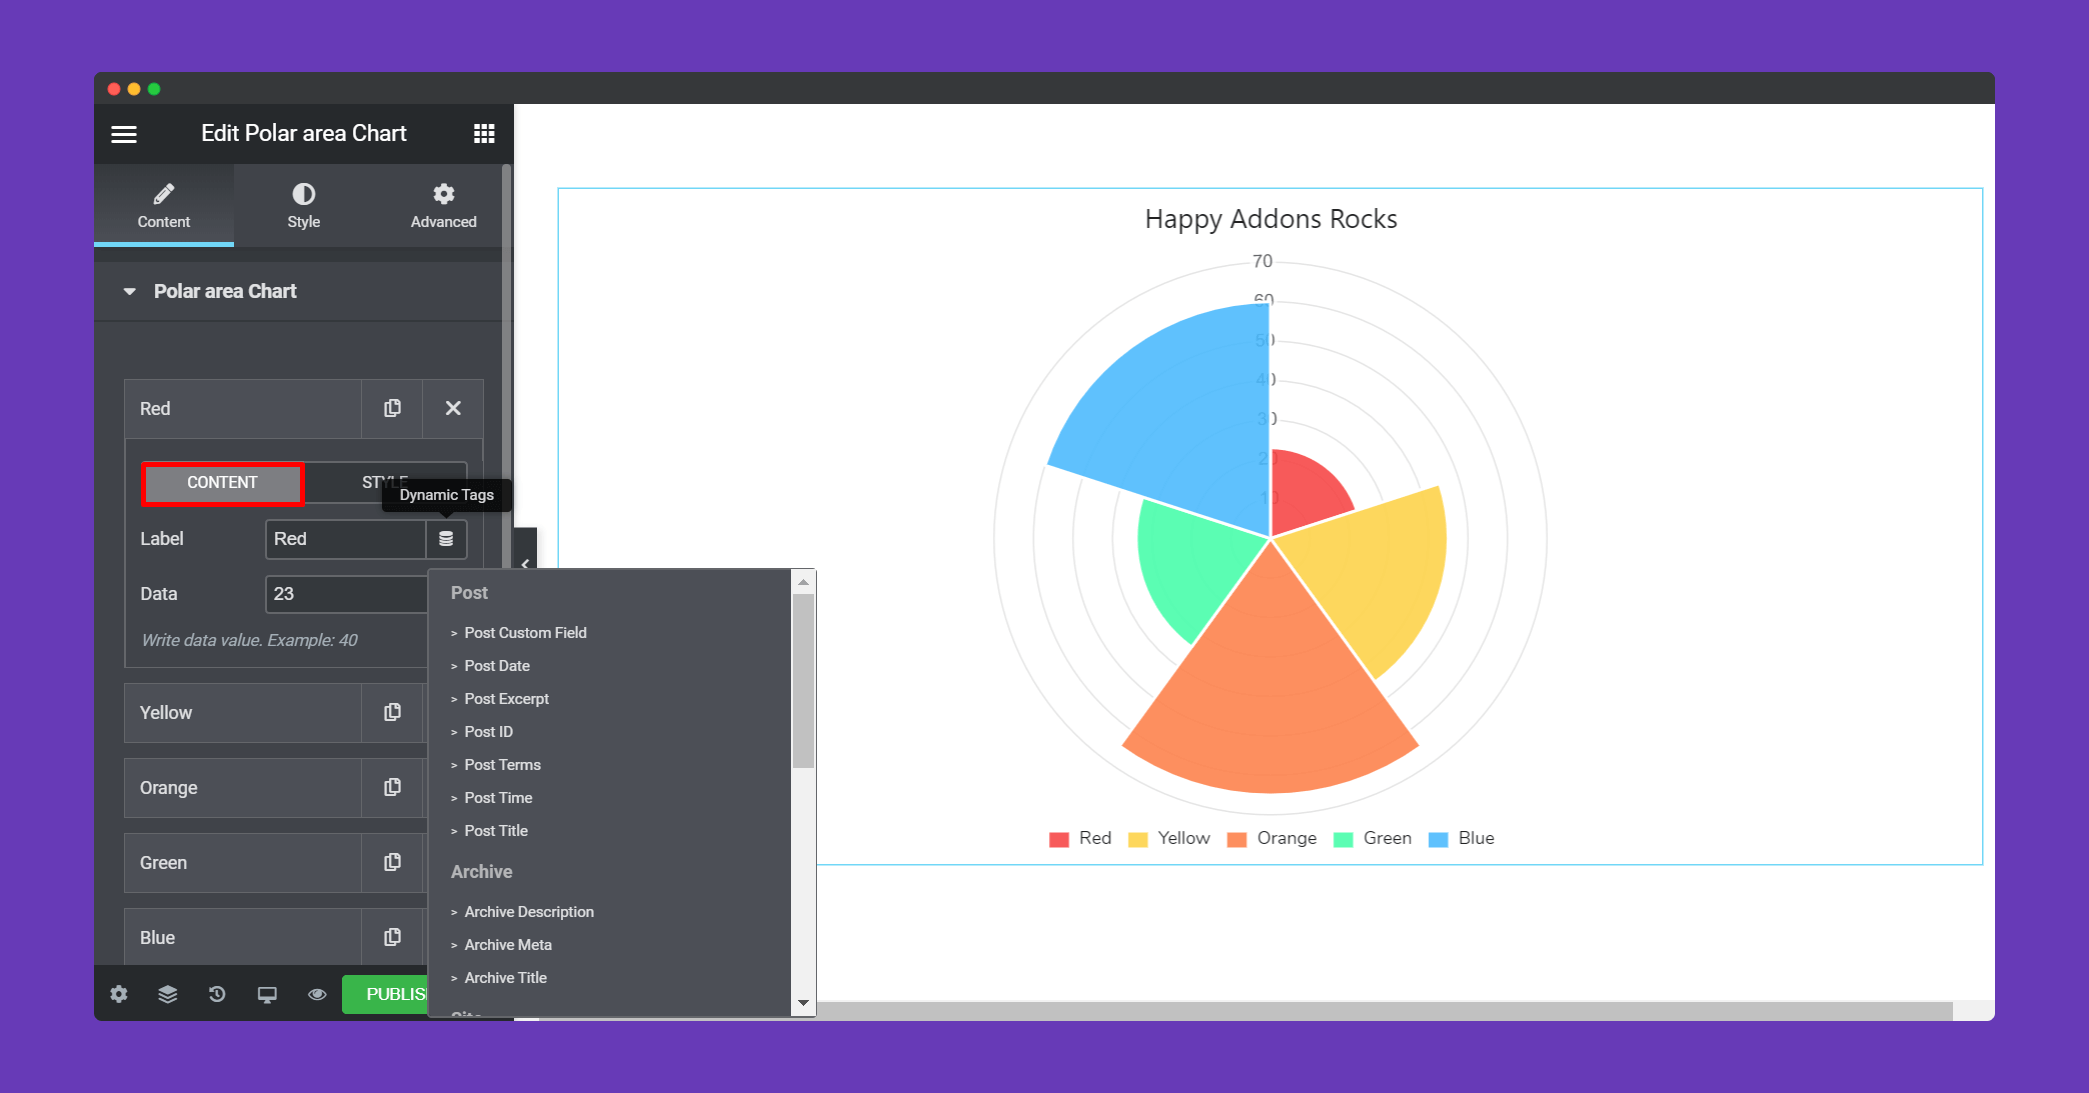
Now, you can Add Items as many as you like. In the content section, you can give a name to the label and add Data. Remember, the amount of space the item will take in the chart depends on the data.
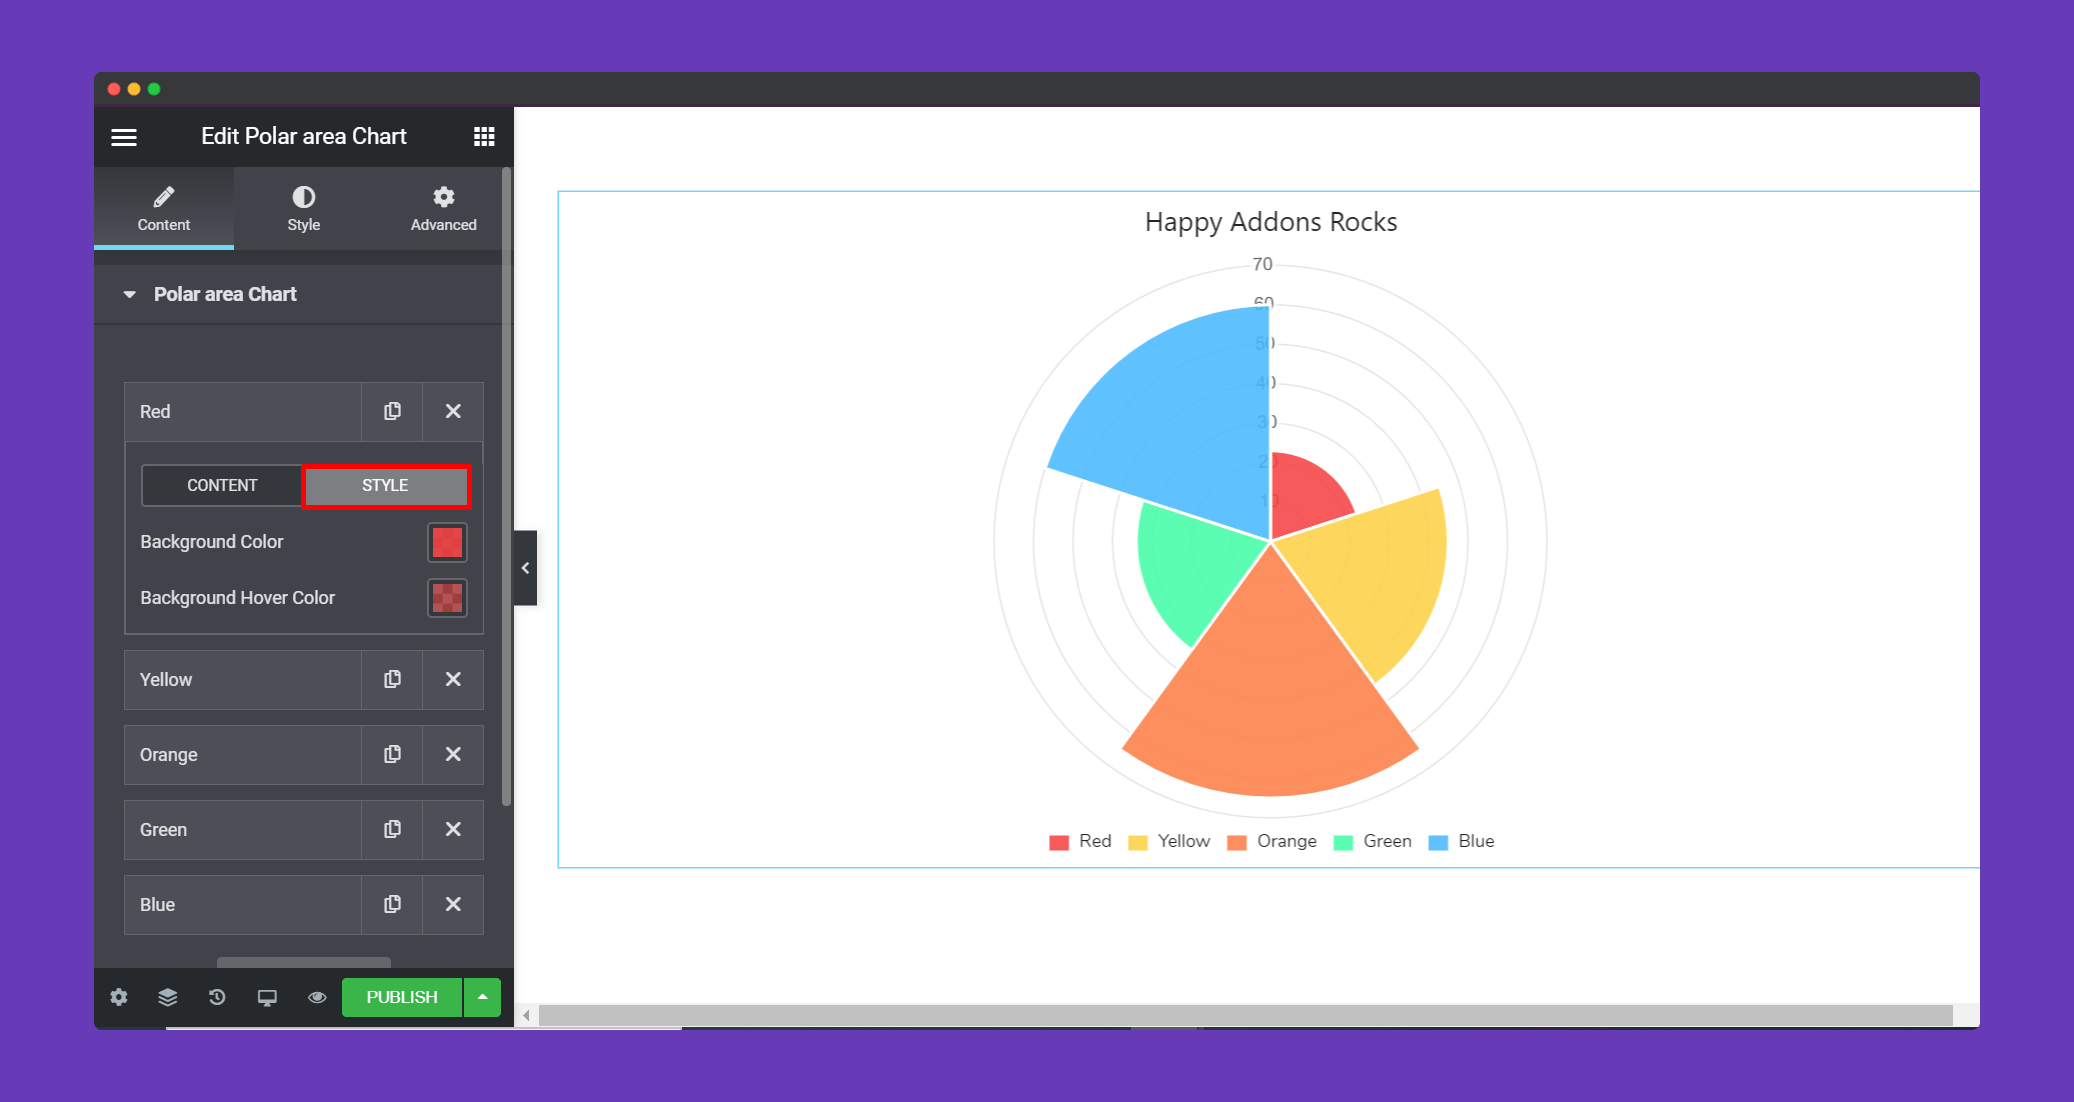
In the style section, you can add background color and background hover color.
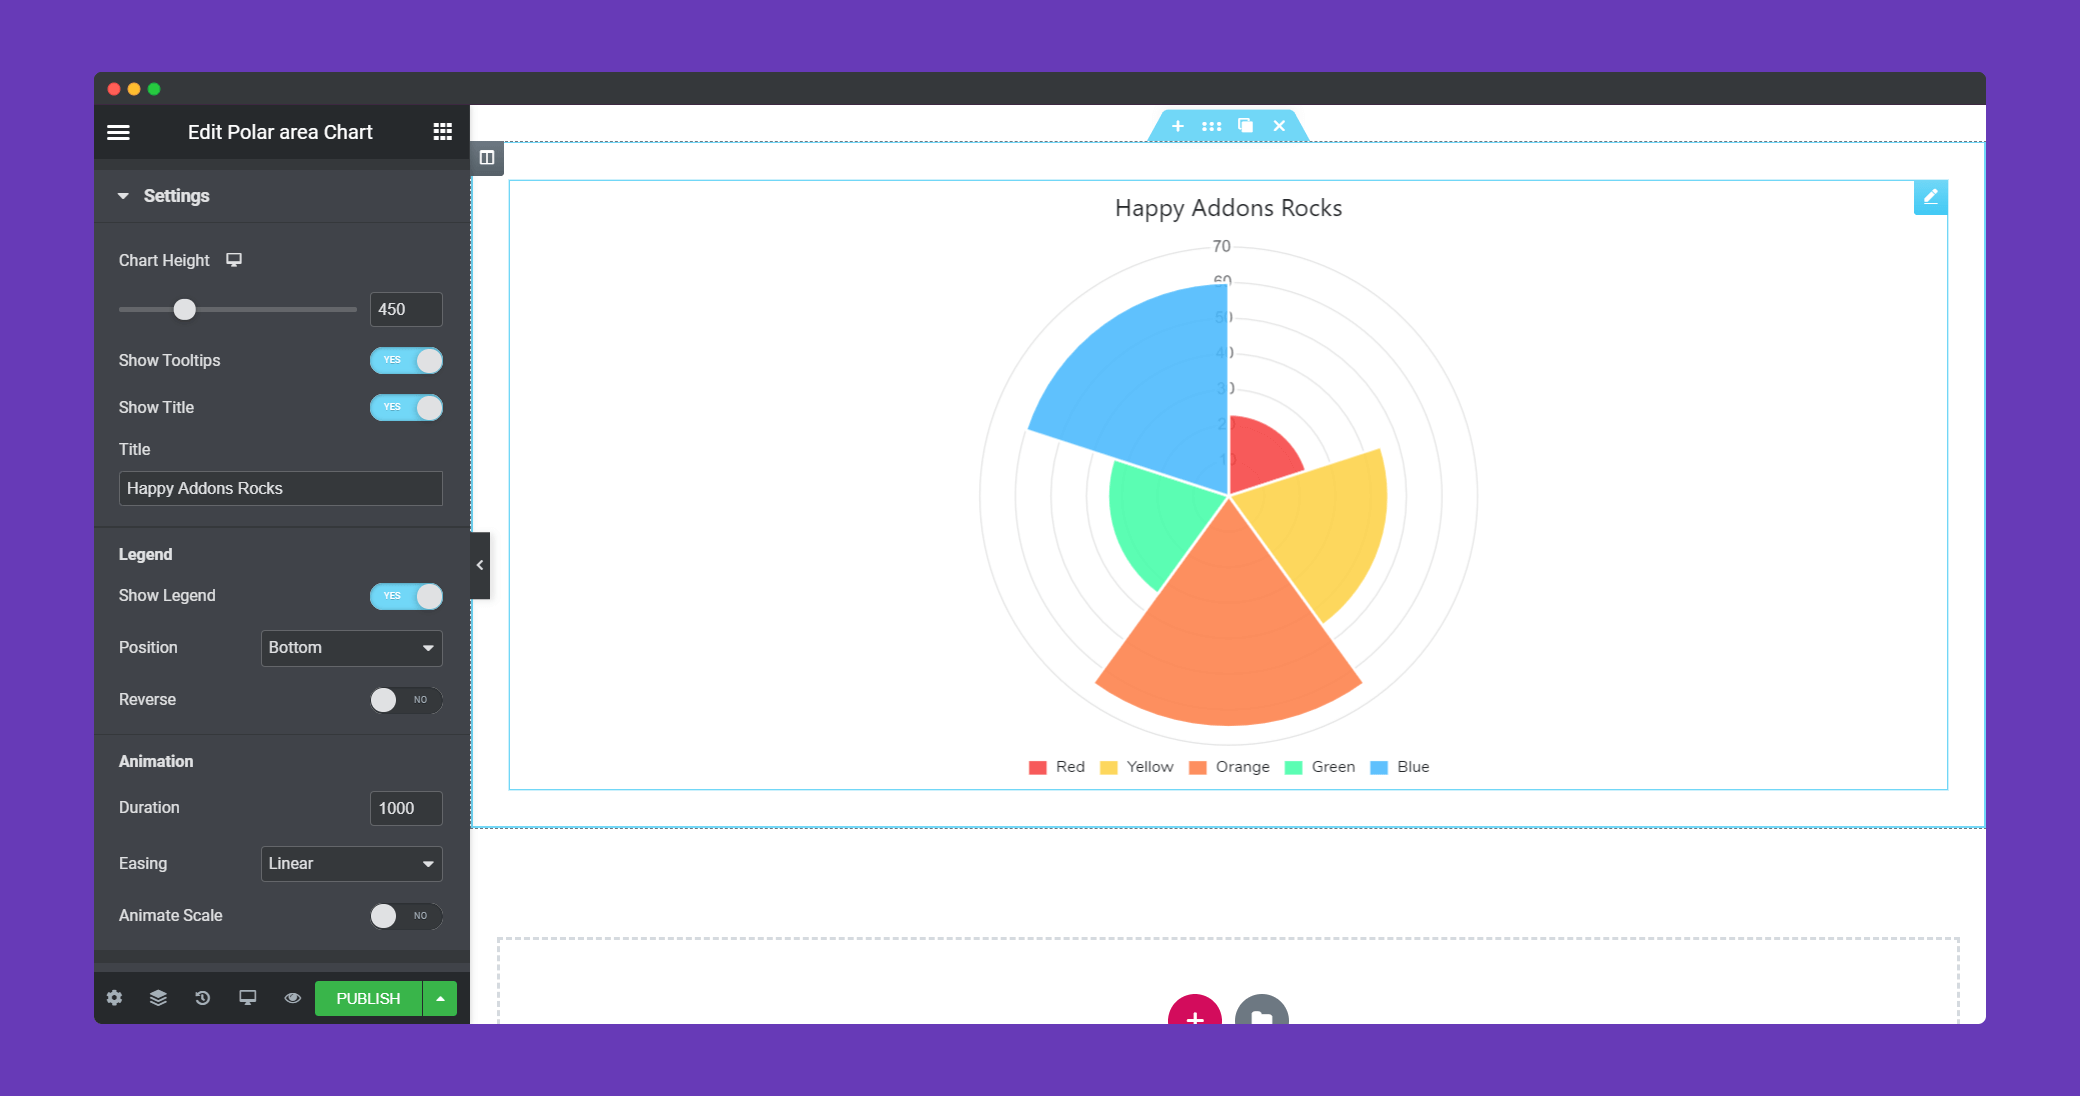
In the Settings section, you can determine chart heights, enable tooltip, legend. Also, you can add animation to the chart.
Step 3:
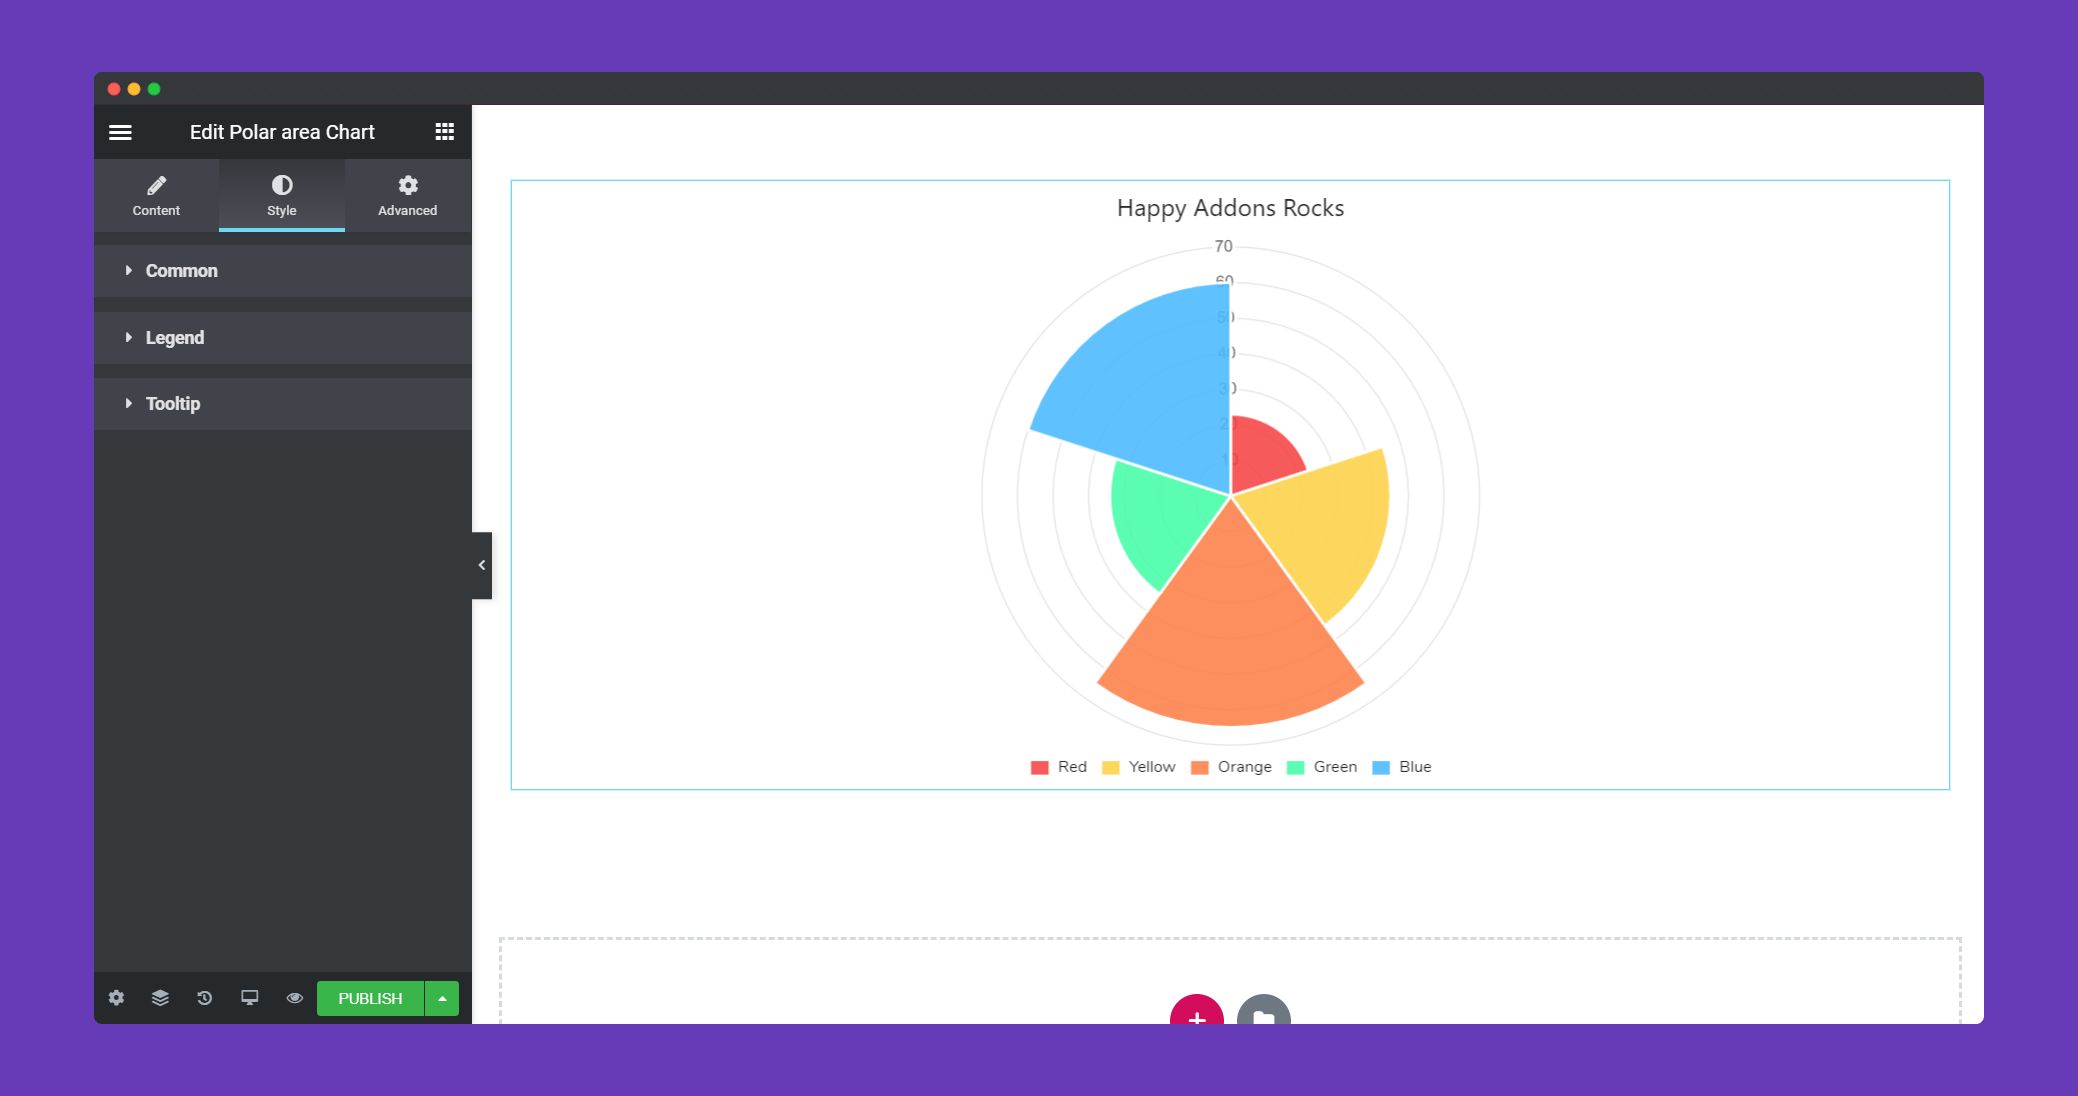
In the ‘Style‘ section, you will have options to design ‘ Common,’ Legend’, and ‘ Tooltip’.
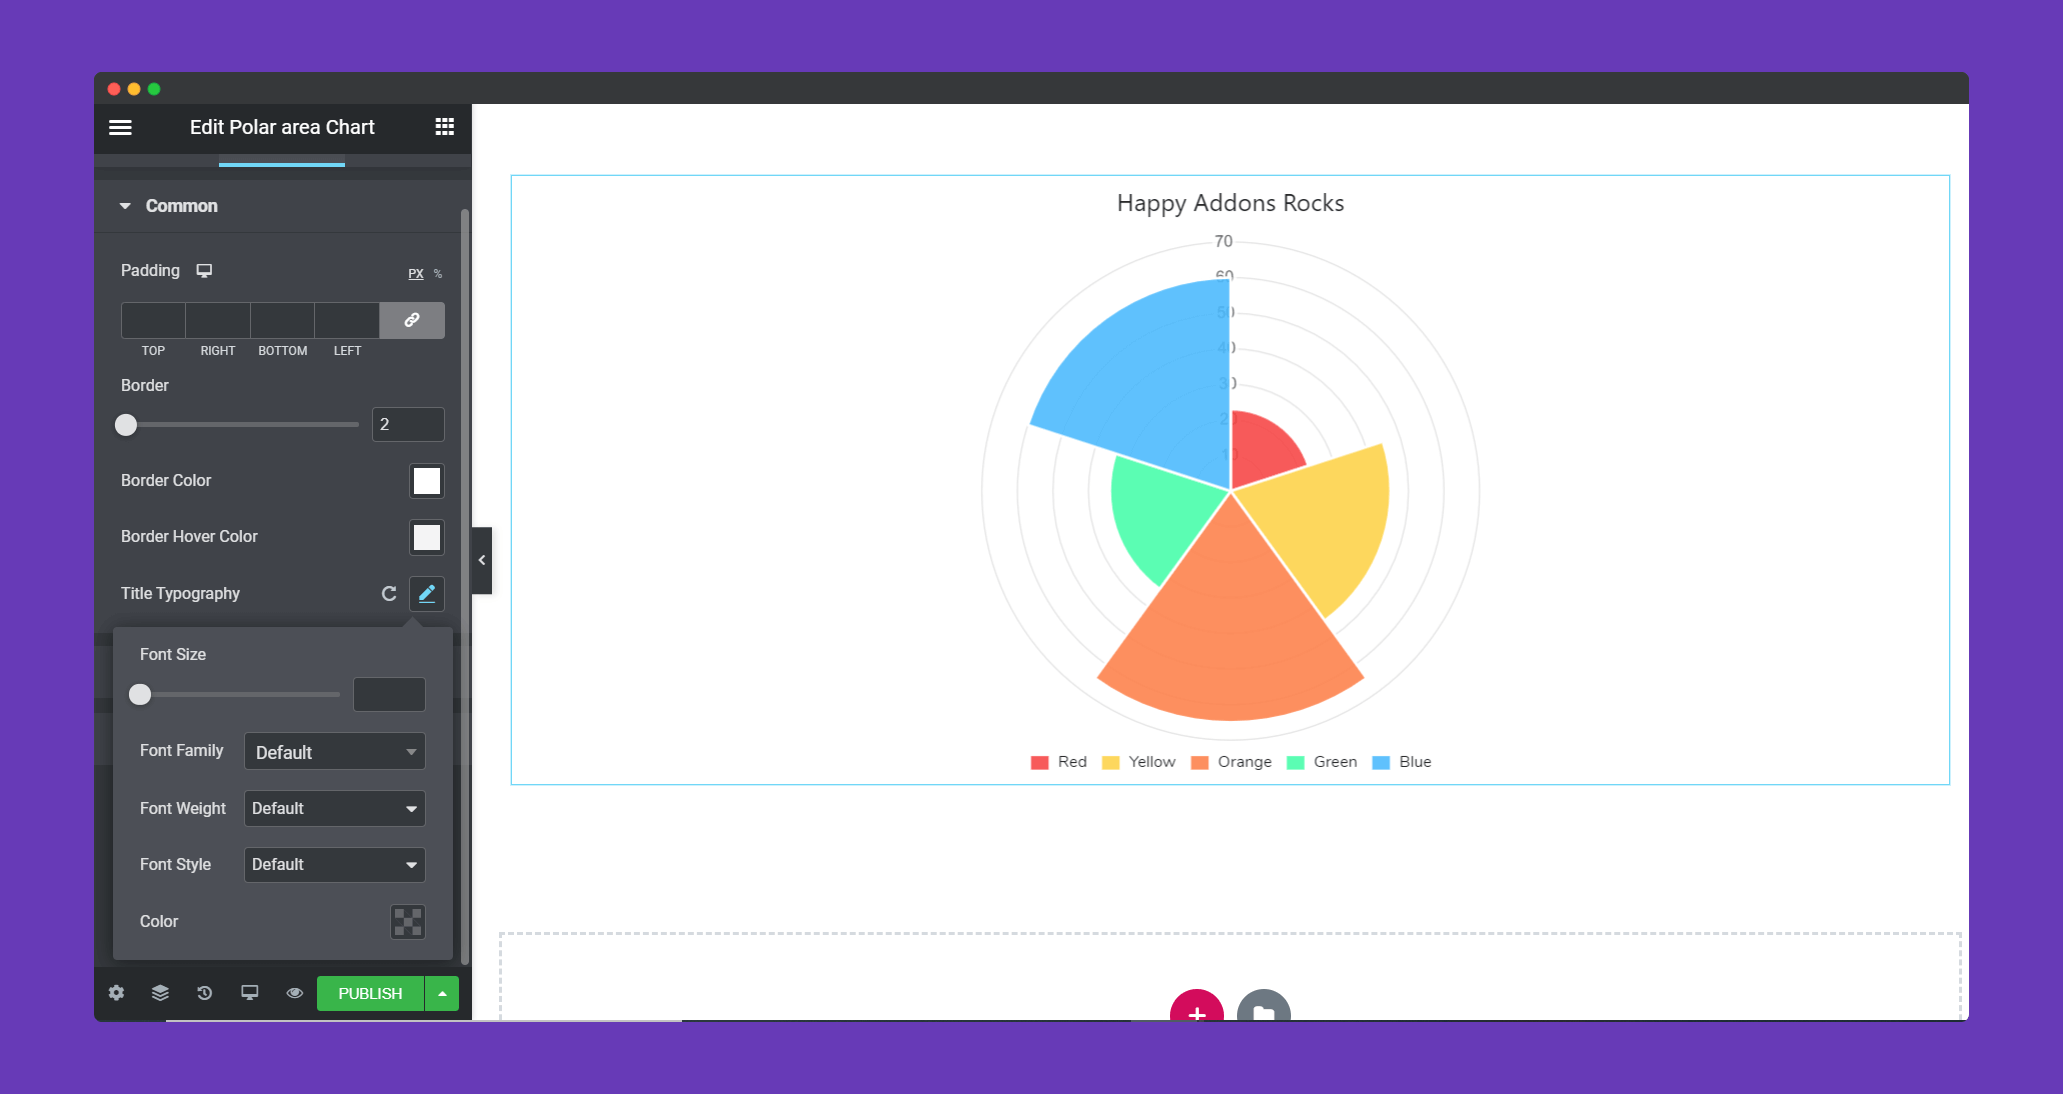
In the Common section, you can add padding, border width, line tension, point border width.
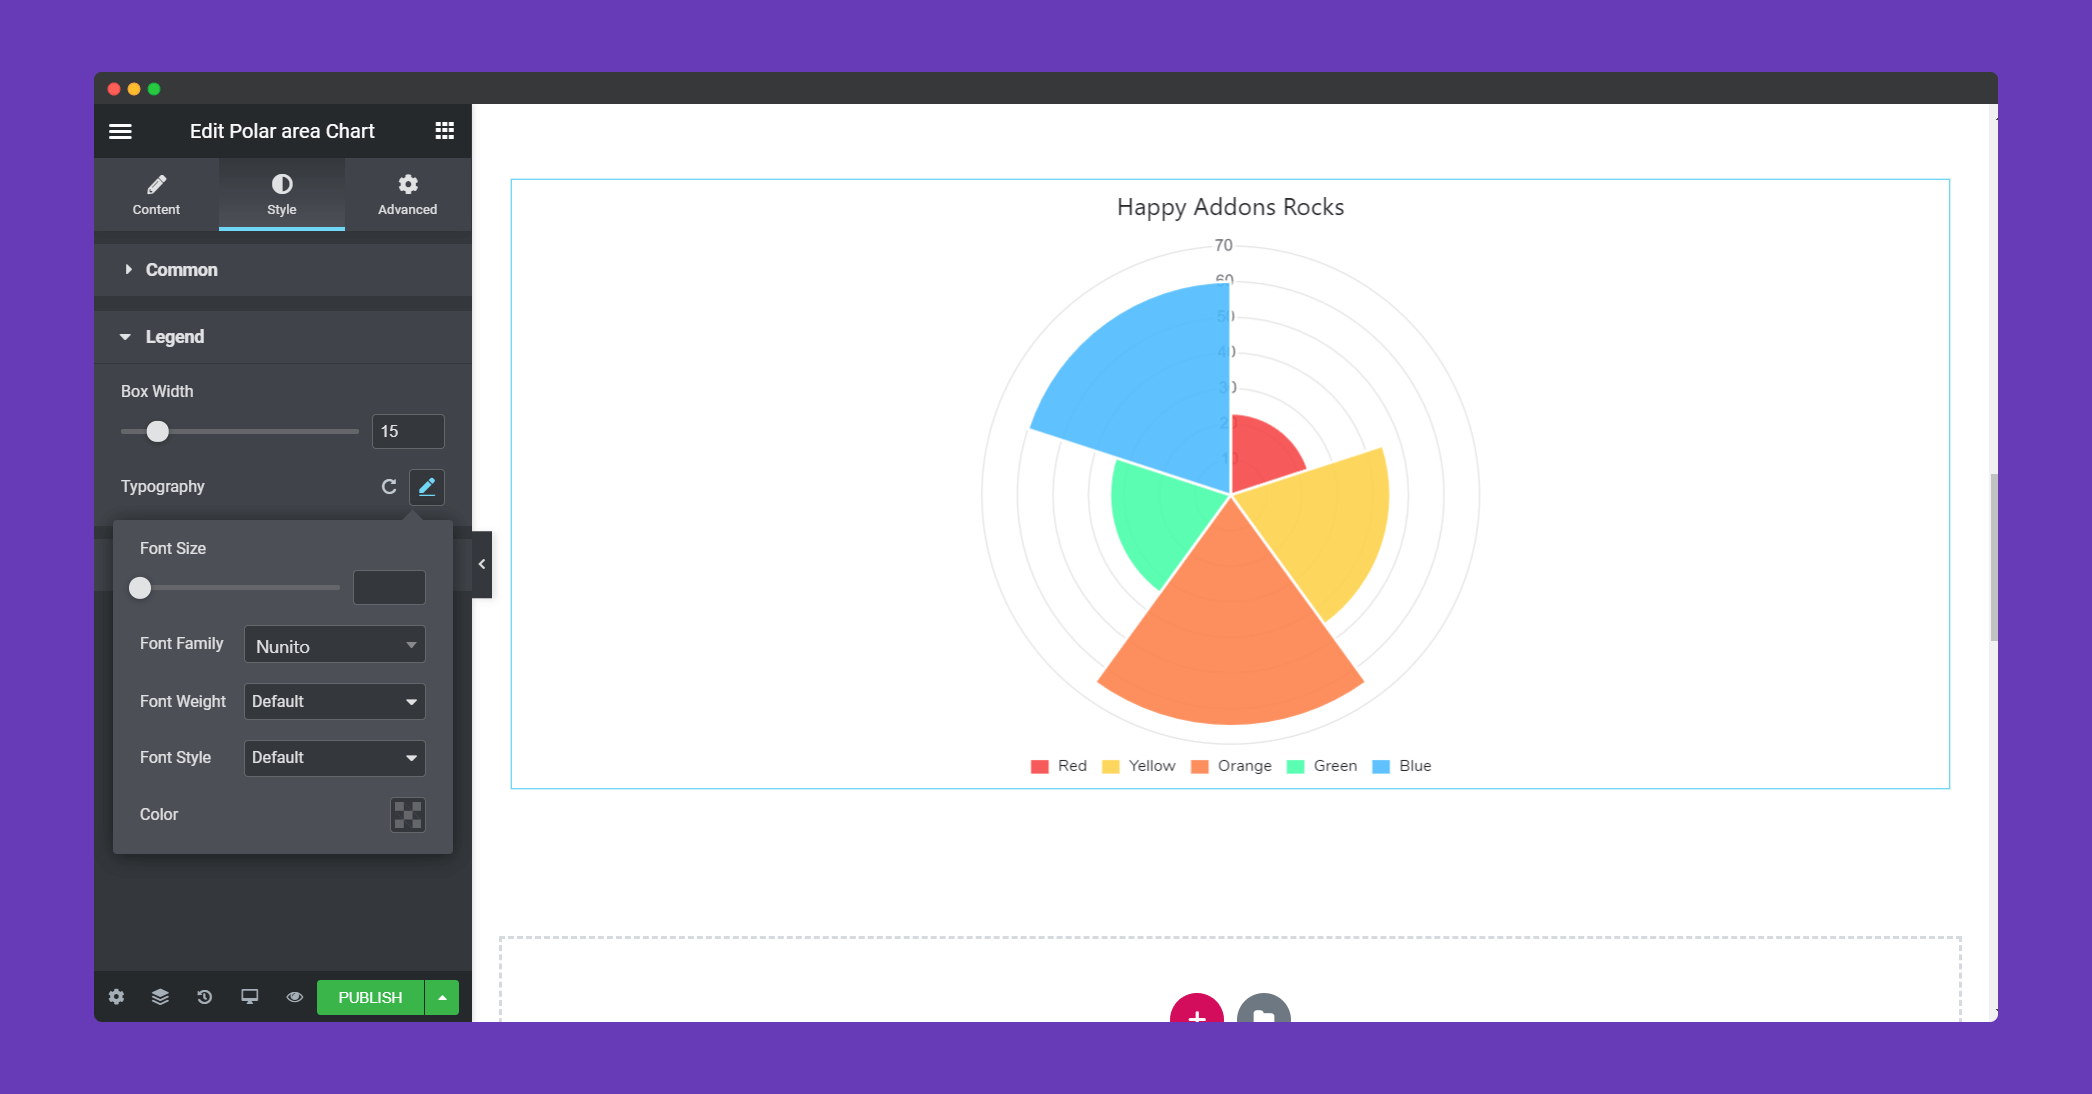
You can set box width and typography in the Legend section.
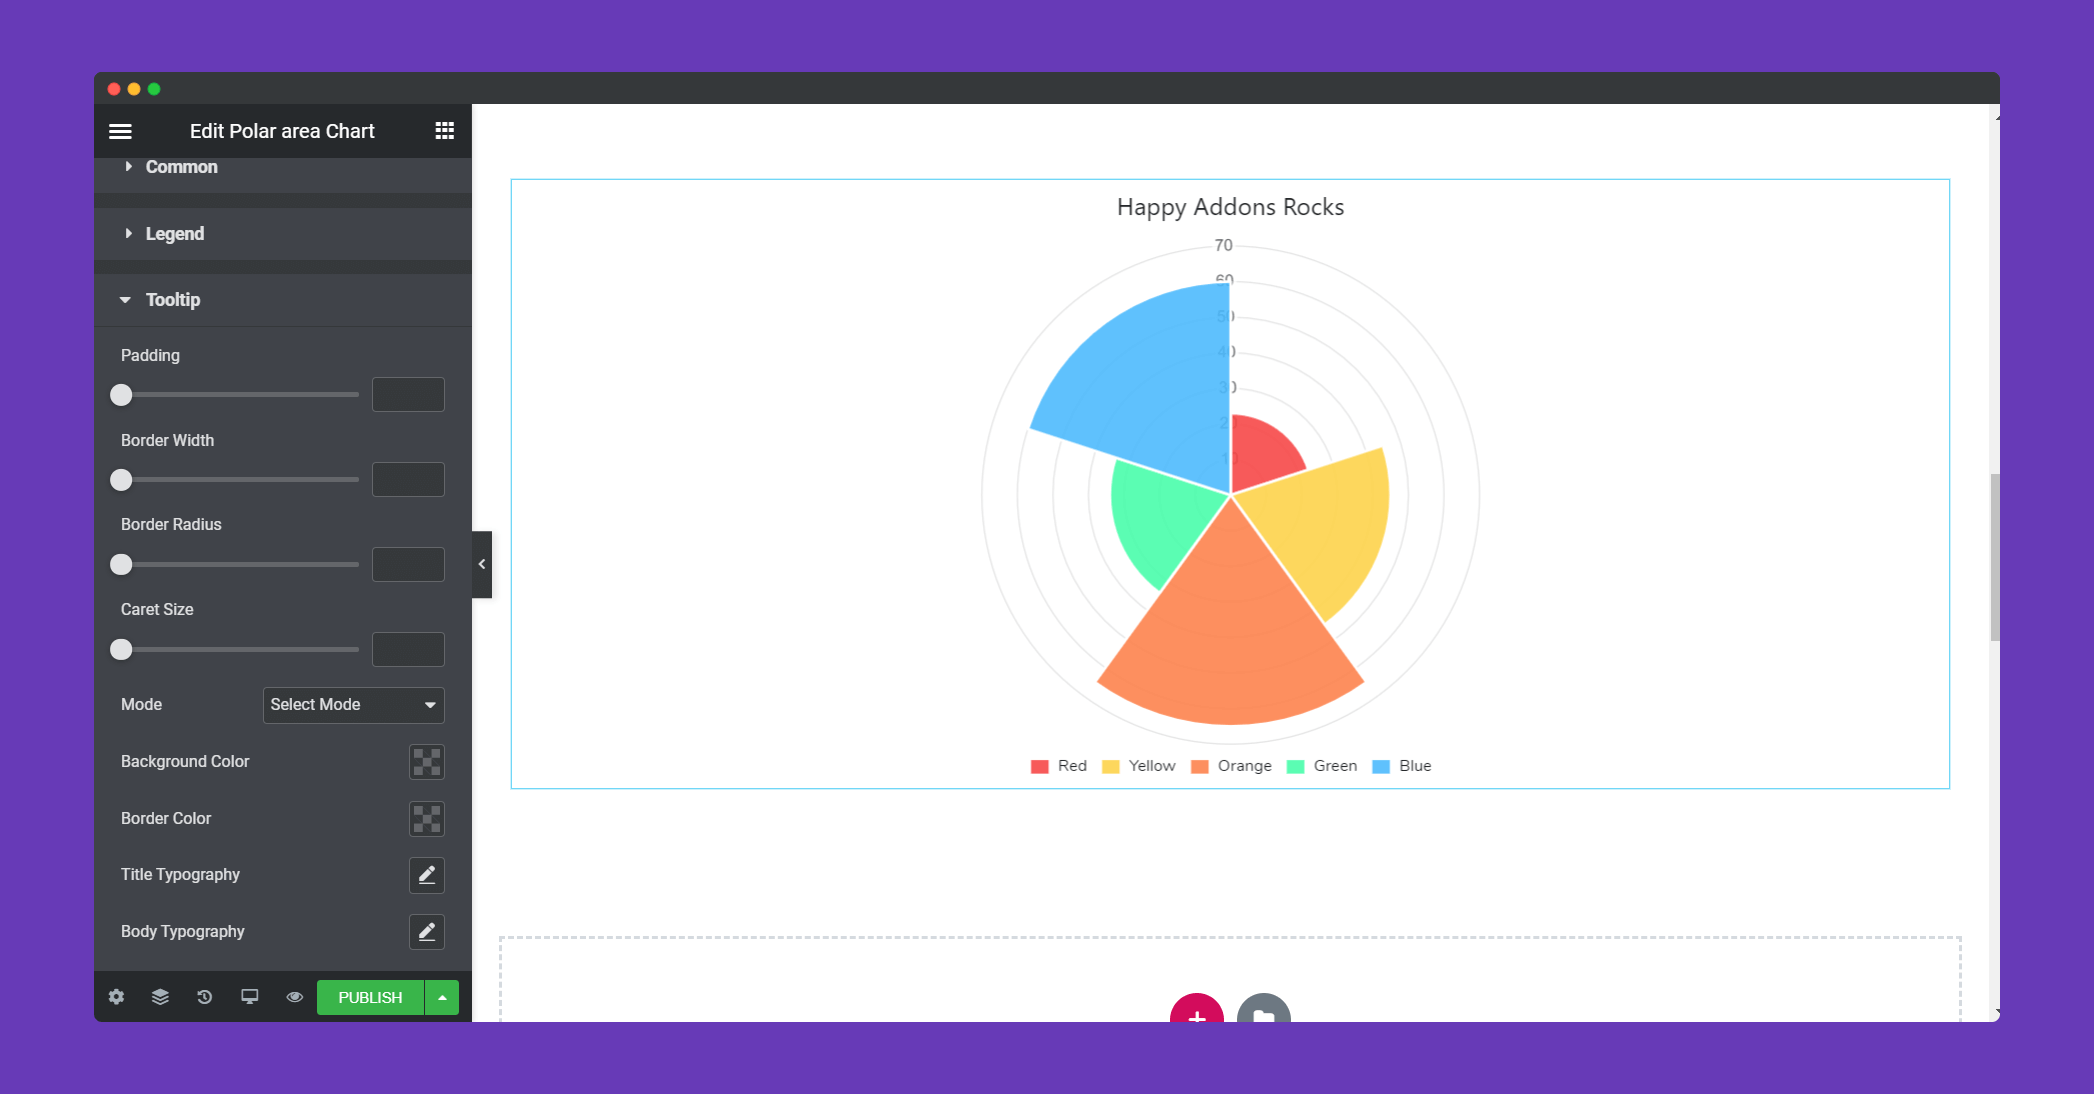
In the Tooltip section, you can set padding, border width, radius, caret size. Also, you can select mode, background color, border color, title, and body typography.
Step 4:
If you want to add motion effects, happy effects, background or make it responsive and more intriguing, click on ‘Advanced‘ to explore those options. the ‘Advanced‘ is a default feature of Elementor. Give a read to this Document to know more about Advanced features and its uses.
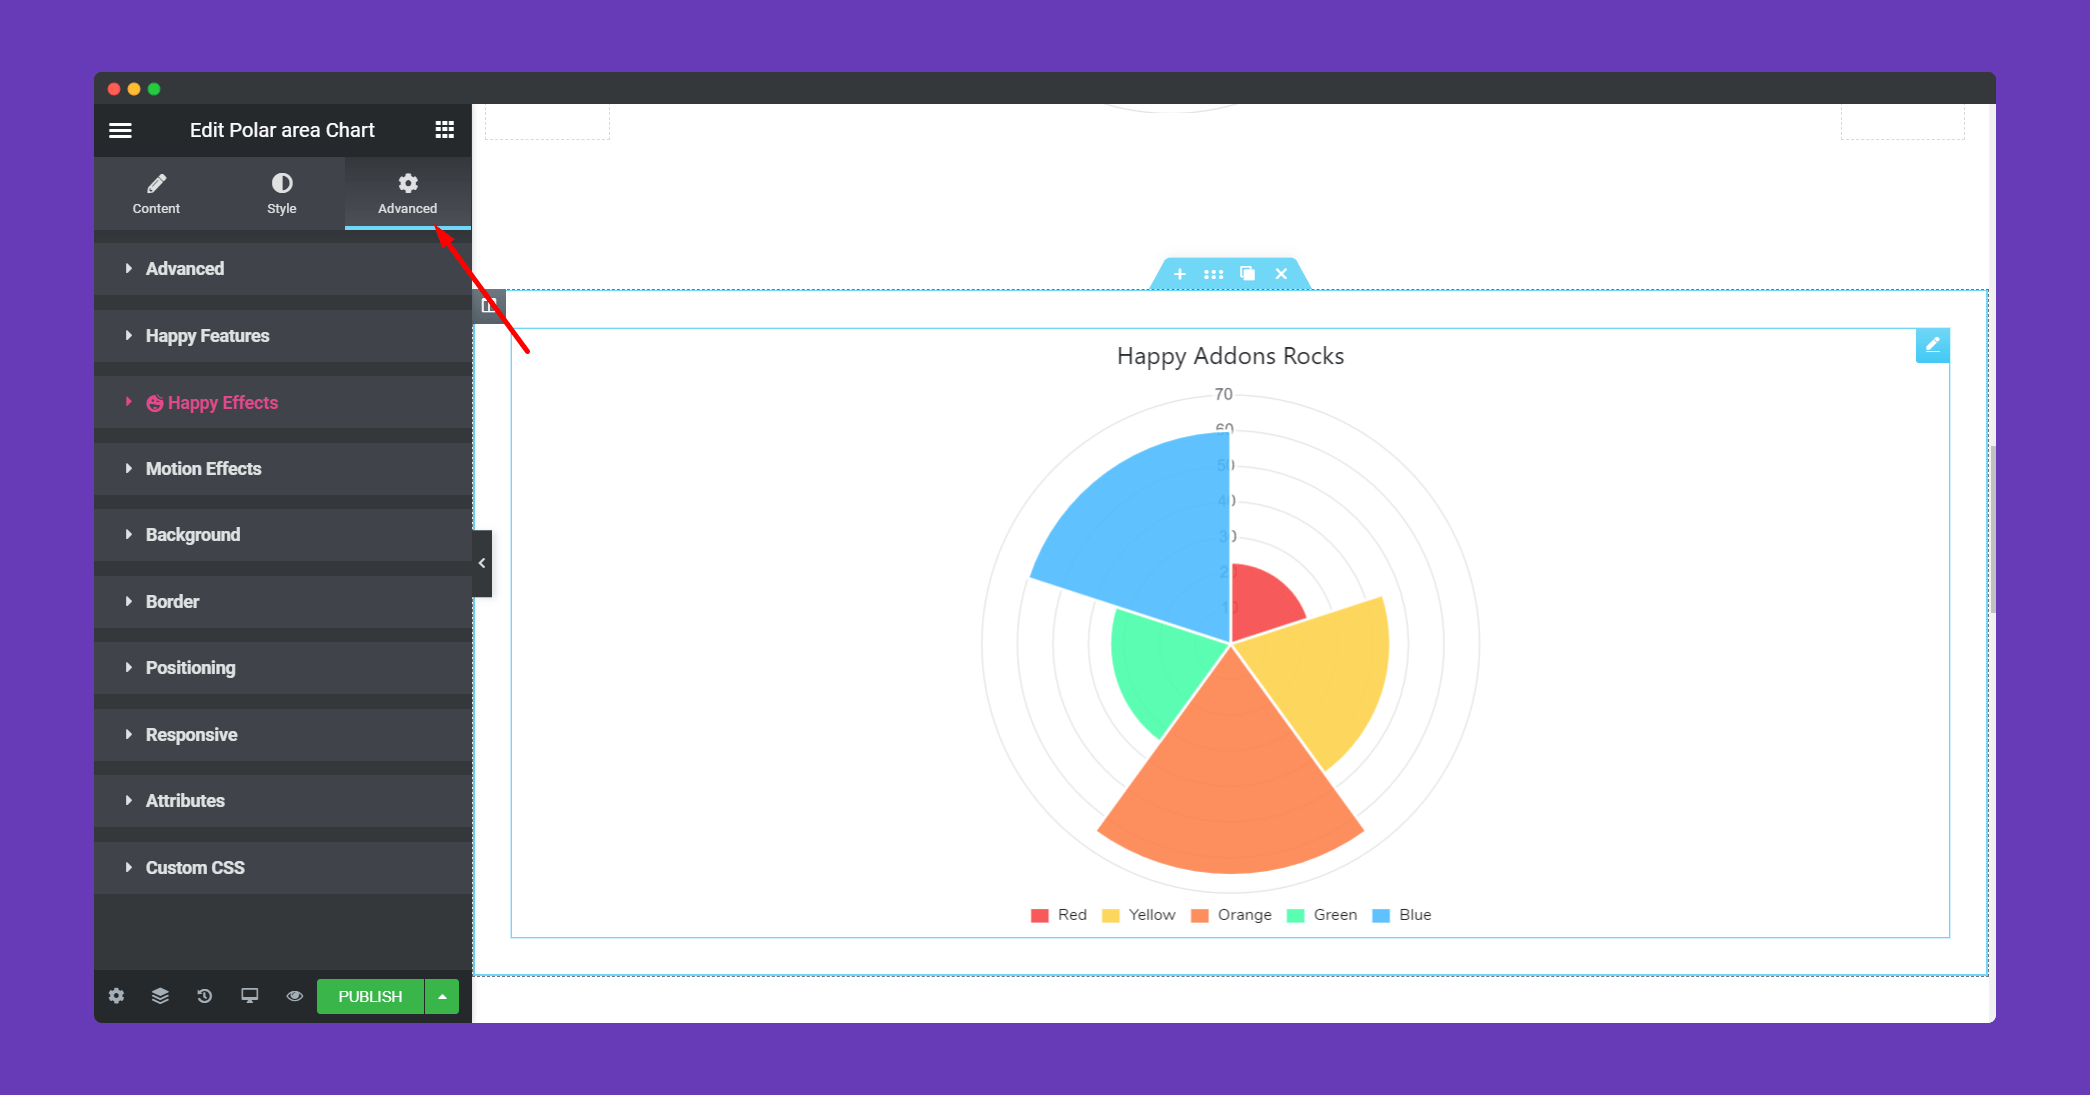
Lastly, you will see a beautiful Polar Area chart widget on your website.
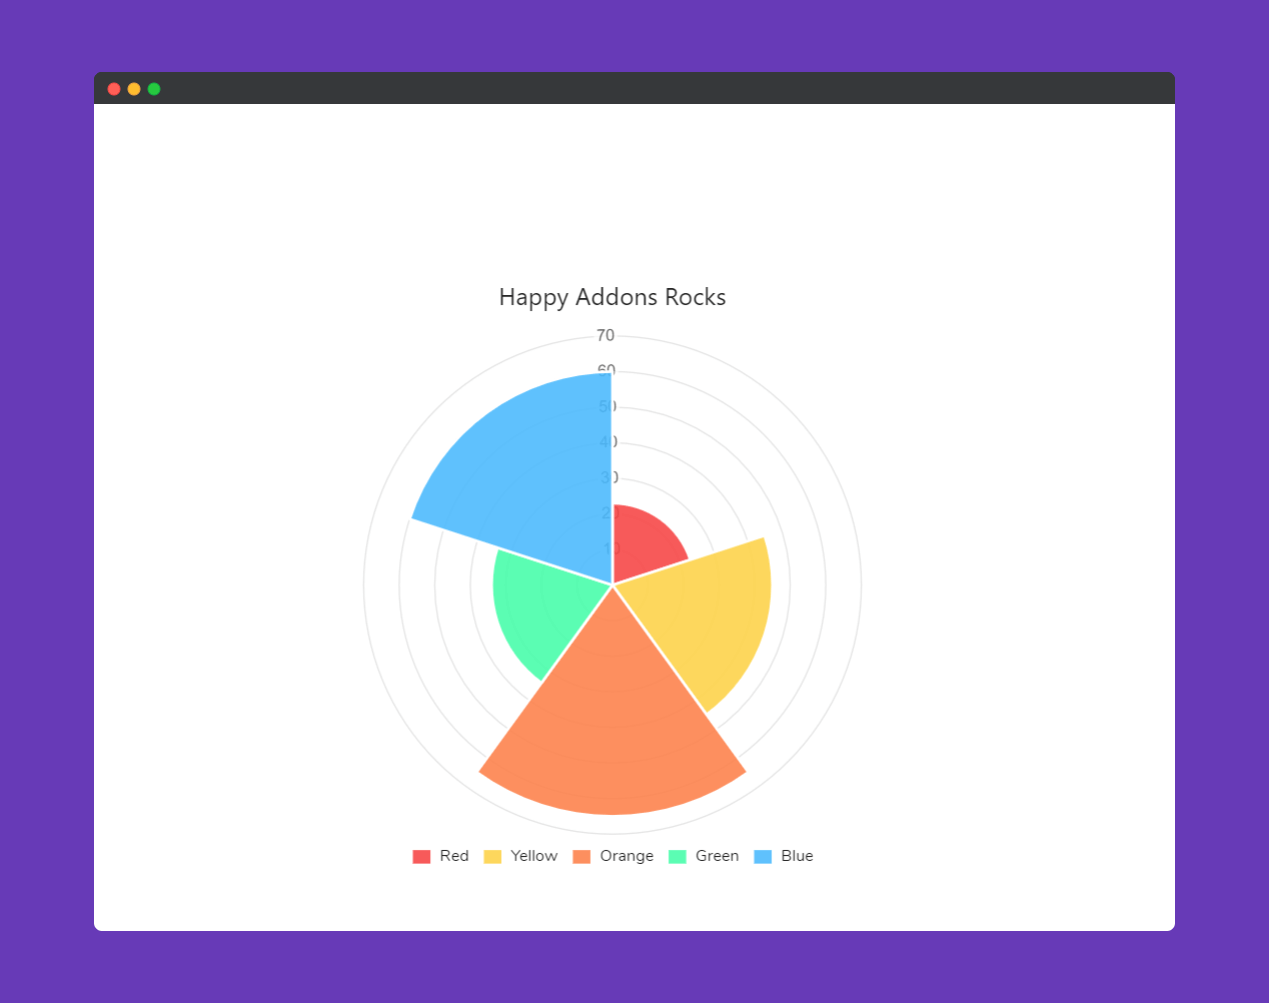
That’s it!
